Operating an ASP.NET Core application on Azure App Services: real world troubleshooting with WinDbg
I got a call last Monday at 11am that some alerts have fired, and we got the first tickets from our users. After a short analysis, we found that the handle count of an instance has reached the upper limit and all available TCP connections have been used up.
We were not able to reproduce the problem but we got a bunch of memory dumps, so let’s dig into it.
The environment
- ASP.NET Core 2.1 application hosted on Azure App Services
- Cosmos DB, Blob Storage, Log Analytics, Application Insights
- A bunch of Microservices on different App Services and some Azure Functions
- Application Gateway with WAF enabled
- ~125k active users
Tools used for the analysis
- MemoScope (https://github.com/fremag/MemoScope.Net)
- WinDbg (part of the Windows SDK https://developer.microsoft.com/de-de/windows/downloads/windows-10-sdk)
- Binary package of the matching .NET Core SDK (see below)
- SOSEX (http://www.stevestechspot.com/default.aspx .NET Core is not supported officially but let’s try our luck)
- DnSpy (https://github.com/0xd4d/dnSpy)
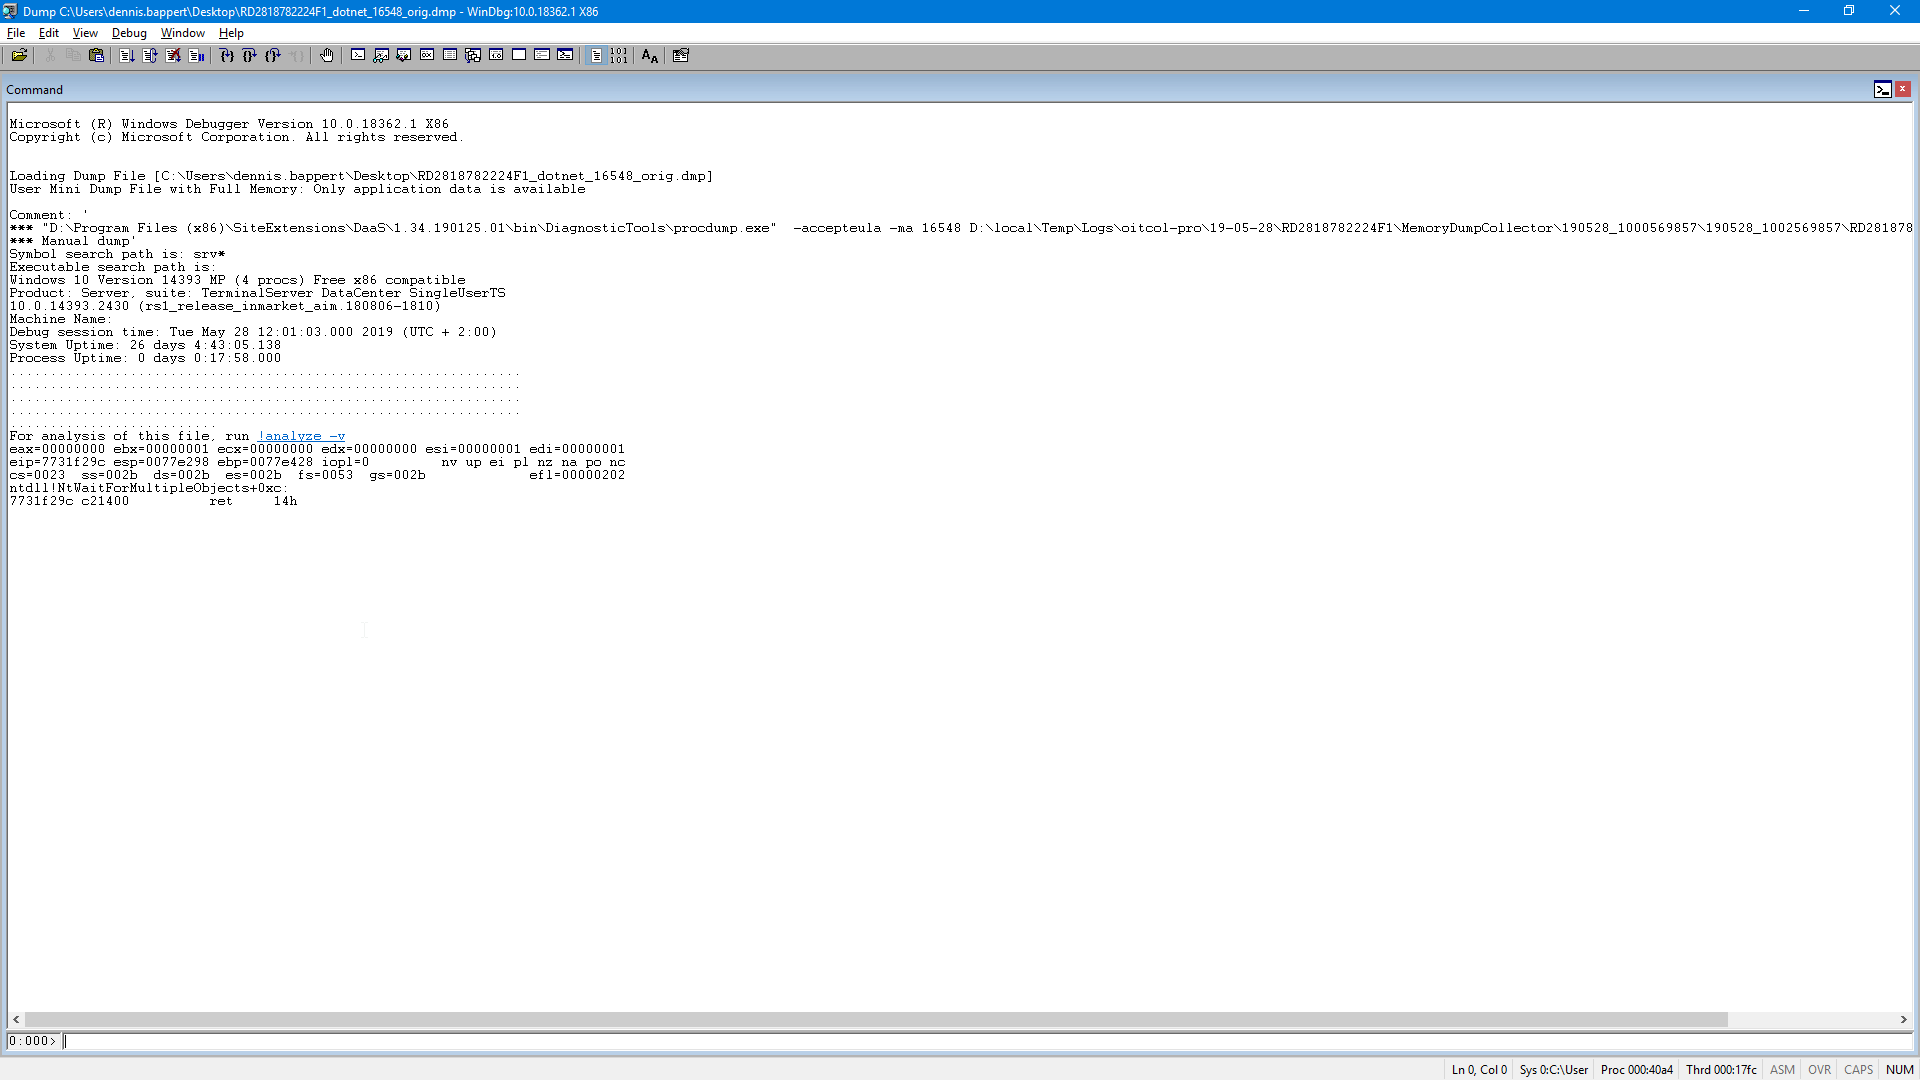
Let’s get started by opening up WinDbg (X86 in this case, don’t ask me why) 👍
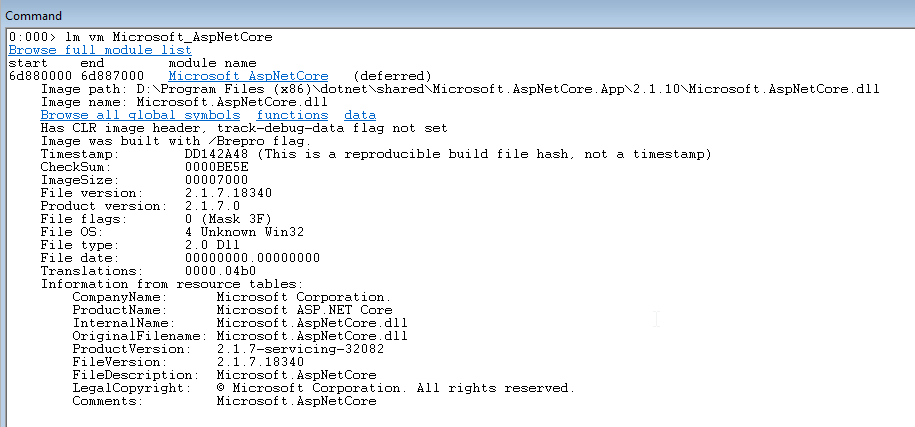
The first thing we want to do is to load the correct version of “sos.dll” (SOS debugging extension). We need to find the correct version of ASP.NET Core by looking into the loaded modules. In this case we’re not using a self-contained deployment approach so we can easily find the loaded runtime by looking at the Microsoft.AspNetCore assembly:
lm vm Microsoft_AspNetCore
From here we can see the Image path pointing to version 2.1.10.
We just need to download the correct SDK (binary package is fine) to get the right version of sos.dll.
.load C:\Users\dennis.bappert\Downloads\dotnet-sdk-2.1.603-win-x86\shared\Microsoft.NETCore.App\2.1.10\sos.dll
The first thing we want to look at is the threadpool utilization because high handle count always looks like some kind of threadpool exhaustion or starvation.
This confirms our assumption: we can see all 682 available threads being used with no idle threads at all. The application itself does not suffer from any CPU time bottlenecks as the utilization is at only 3%.
Let’s check if we have any exceptions on our threads:
!threads
Unfortunately, in this case there a no exceptions on the threads.
But we can search for all exceptions which are still somewhere on the heap to get an understanding what happened:
.foreach (ex {!dumpheap -type Exception -short}){.echo “###############################################”;!pe ${ex} }
There are thousands of SocketExceptions in the dump which clearly indicates that the requests are hitting a timeout and the clients abort the requests after timing out.
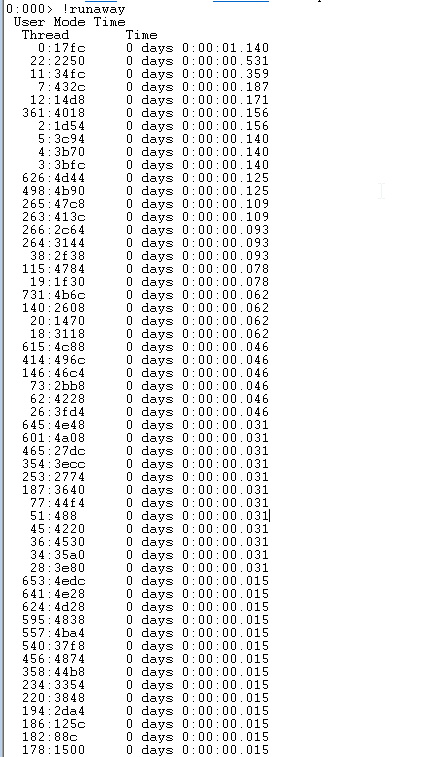
Let’s dig deeper and look for any runaways:
!runaway
Nothing suspicious, looks ok.
Let’s try to load SOSEX to use the !dlk command to spot any obvious deadlocks:
.load C:\Users\dennis.bappert\Downloads\sosex_32\sosex.dll !dlk
Again, no luck.
Okay now I just want to look at the stacktrace of a random set of threads to spot any similarities in their stacktrace:
~[threadnum]e!clrstack
All samples I looked at where stuck at the same function call. We can see that there is no AsyncStateMachine after the “Get(string, string)” call which looks suspicious because it looks like there is an async call which gets executed without async / await.
Let’s take a look at the IL code to see the exact function call:
!U /d 2192eb18
We can see a function call to GetAwaiter() which is definitely a synchronous execution of a Task. Otherwise we would see an AsyncStateMachine, <MoveNext>, etc. at this stage.
In order to verify this assumption, we can take a look at the decompiled source by dumping module and opening it with DnSpy. We need to find the correct module first:
!dumpdomain
And then export the correct module:
!SaveModule 1e6a431c C:\Temp\module.dll
I opened the module with dnSpy to inspect the decompiled code.
This looks like a anti-pattern at first but after digging deeper, I figured out that the developers were forced to implement the TokenCache class (Microsoft.IdentityModel.Clients.ActiveDirectory) for OpenId Connect authentication using any sort of synchronous wrapping. Cosmos DB is used as a distributed cache behind the scenes but the DocumentClient does not expose any synchronous methods and the TokenCache does not expose any asynchronous methods (https://docs.microsoft.com/en-us/dotnet/api/microsoft.identitymodel.clients.activedirectory.tokencache?view=azure-dotnet)
There are a few open questions after we made all the findings above:
- How can we implement the function properly in this scenario? Maybe using Task.Run(() => Get(…).GetAwaiter().GetResult()?
- Why is the line above causing deadlocks / massive threadpool exhaustion if we keep in mind that ASP.NET Core has NO SynchronizationContext and the lines above should only cause some threadpool starvation (if any)?
- We verified that only one instance is affected even with evenly distributed traffic across all instances.


