Processing and Presenting IoT data with Azure services
The previous article took off at the point where we were able to generate data with our sensors and send them over the internet into the Azure IoT Hub. If you want to know more about generating IoT data in the context of Azure, let it be with real sensors or simulated data, we recommend you read the previous article.
To be able to display useful information regarding our office to our team, we need to process, store and visualize the unstructured IoT Data we collected earlier. The data itself is transferred as a stream to Azure IoT Hub. A very useful feature of many Azure services is that they can produce or consume (publish and subscribe) data provided by other Azure services.
Microsoft provides multiple examples under the topic ‘streaming at scale‘. Here we can find an overview of different Azure services as well as independent open source applications that can be brought together to process, store and visualize streaming data.
Processing Services
Azure Stream Analytics allows you to process all kinds of streaming data. Within the service you can define queries that map your input data to output data. These queries are expressed in an SQL-like query language.
Inside Stream Analytics you can add new functions that empower you to detect anomalies in your data like short- or long-term/persistent data changes. These functions can either be defined in JavaScript directly in the browser or by connecting existing Azure Machine Learning functions to the stream analytics job.
With Azure Functions, you can access a wide range of connectors and keep the freedom to create applications according to your needs. This service allows you to create individually complex applications programmatically. You can also use different programming languages. Azure Functions can be developed in the Azure Portal itself or in the IDE of your choice.
If you want to know more on how to use Azure Functions (especially in the development context) we recommend you to read our other articles.
Presentation Services
Both services, IoT Hub and Stream Analytics include the possibility (as most of the azure services) to monitor the services themselves. In the Monitor-Pane you can create simple charts with predefined metric, create new metrics and based upon these metric alerts. Two other services provide a more powerful approach to present data visually.
PowerBI is a very powerful tool, to show, process and visualize large amount of data sources.
Time Series Insights is another powerful analytics tool designed for data sources that focus on changes over time or streaming data.
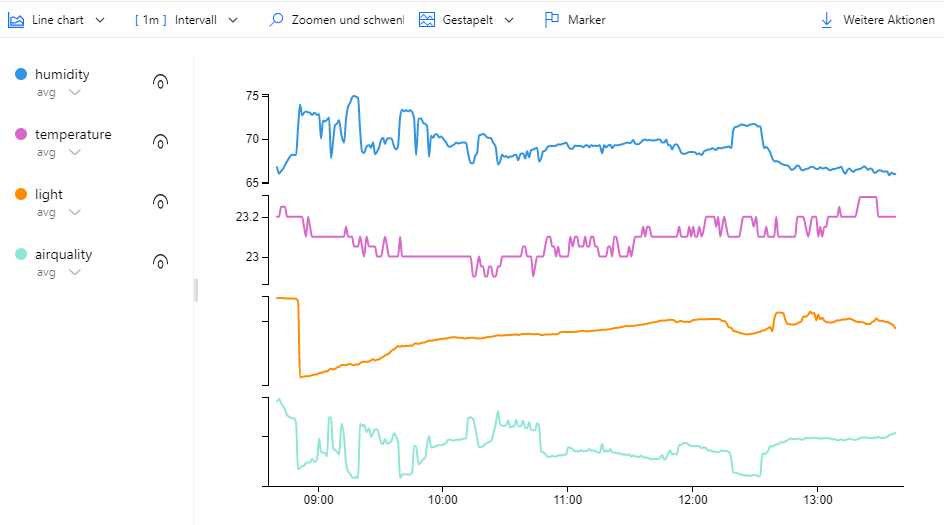
Here is an example, that shows some of our sensor data in the Time Series Insights Dashboard:
Date Storage
Cosmos DB is an azure service providing NoSQL databases. The service focusses on high scalability and global availability. If you want to read more about this service, especially in the context of development, we recommend you to read our other article.
Our approach
For our project we agreed on using Azure Function to process all incoming IoT messages. The input data of the installed IoT Hub could be easily added and configured over the Azure Portal.
In the Azure Function we wanted to add more meta information (like message-id and date) to the messages. The code itself can be implemented in multiple languages. We decided to use the following JavaScript code:
module.exports = function (context, IoTHubMessages) { context.log(`JavaScript eventhub trigger function called`); var messageId = 0; var temperature = 0; var humidity = 0.0; var sound = 0; var airquality = 0; var light = 0; var deviceId = ""; var currentDate = new Date(); IoTHubMessages.forEach(message => { context.log(`Processed message id: ${message.messageId}`); messageId += message.messageId; temperature += message.temperature; humidity += message.humidity; sound += message.sound; airquality += message.airquality; light += message.light; deviceId = message.deviceId; }); var output = { "deviceId": deviceId, "messageId": messageId, "temperature": temperature, "humidity": humidity, "sound": sound, "airquality": airquality, "light": light, "doctype": "measurement", "date": currentDate }; context.log(`Output content: ${JSON.stringify(output)}`); context.bindings.outputDocument = output; context.done(); };
As output we defined our CosmosDB connection with a special partition key (called ‘measurement’) to distinguish the IoT messages from other database entries.
Because we planned to use a ASP.NET Core Web Application, we decided to implement a customized visualization for our IoT data. Another fundamental consideration for us was that the project should be as cost-saving as possible. Therefore, we dropped most of the “cost-intense” services like “Time Series Insights” or “PowerBI” in advance of a custom self-developed application (Keep in mind: we love to develop!).
We developed a simple widget mechanism that allowed us to separate the application into different widgets (like Jira Tasks, free meeting rooms or a team calendar) depending on the data and different visualization approaches (numbers, text, charts, tables, graphics).
This an extract of our IoT Widget code in the ASP.Net Core Web Application controller. As you can see, we are querying ComosDB for our measurement data for the last 5 minutes. After that we are generating averages to build up each metric.
var query = _documentClient.CreateDocumentQuery<IoTData>(CollectionUri, new FeedOptions { PartitionKey = new PartitionKey("measurement") }) .Where(_ => _.DocumentType == "measurement" && _.Date >= DateTime.UtcNow.AddMinutes(-5)).AsDocumentQuery(); var result = await query.ExecuteNextAsync<IoTData>(cancellationToken); var resultSums = result.GroupBy(x => x.DocumentType) .Select(x => new { Light_Avg = x.Average(y => y.Light), AirQuality_Avg = x.Average(y => y.AirQuality), Sound_Avg = x.Average(y => y.Sound), LastMeasurement = x.LastOrDefault() }).FirstOrDefault();
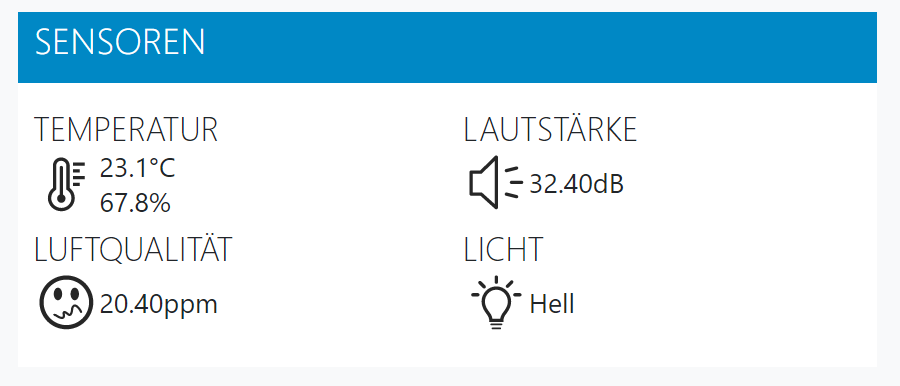
The current version of our IoT widget inside a dashboard is shown in the picture below.
We hope this article has given you a little overview on how to process and visualize IoT Data with Azure.
If you have any further questions regarding this topic, don’t hesitate to send a message to us!
Sources:
[Azure Function Languages] https://docs.microsoft.com/en-us/azure/azure-functions/supported-languages
[Streaming at Scale] https://docs.microsoft.com/de-de/samples/azure-samples/streaming-at-scale/streaming-at-scale/
[Previous blog article]
[CosmosDB article]


